Adrian Herbez Rotating Header Image

Posts Tagged ‘web’

Projection party game (Things)

This was a small project I put together for my girlfriend’s birthday party. She wanted to play a party game whereby:

  1. a topic is presented
  2. each player writes out a response
  3. all the responses are read aloud (with ensuing hilarity)
  4. everyone tries to guess who said what

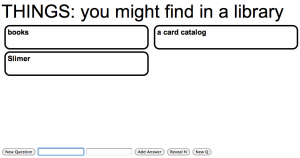
I put together a web-based version of the game that we then projected onto the wall of her living room. The game is controlled by a strip of controls along the bottom of the page which, when presented fullscreen, is cut off by the way I had the projector set up.

The controls allow for a new entry to be entered, with both the name of the person that said it and what they said. Only the actual statement is shown, with the name being hidden. Once everyone has submitted their answer, the ‘Reveal N’ button steps through each answer, revealing who said what.

The topics come from a simple MySQL table, but new topics can also be entered on the fly via javascript (to allow for audience suggestions). If you would like to try it, head here, or click on the image above.

projects , , ,

Game Roller

Just threw together a small tool to help generate game design ideas. The page presents two game mechanics (drawn from the excellent list at Board Game Geek), and two subjects. Mousing over either mechanic shows the description, and reloading the page presents a new combination.

To check it out, either click on the image, or go here

projects , ,

Earthquake data viz demo

I just put together a small demo for the Experimental Interactivity class that I’m teaching this semester at the Academy of Art, and thought I’d post the result. It’s meant to demonstrate:

  • grabbing data from the web (in this case, a CSV file of recent earthquakes
  • altering the data to suit one’s needs (via PHP)
  • writing the data out as XML
  • reading XML into Flash

Pretty simple demo, but not bad for a few hours. All of the earthquakes in the past week are rendered on the map, with a dot that is scaled based on their magnitude. Moving the mouse from left to right across the map causes different quakes to become hidden or visible, depending on magnitude- move left to see small quakes, and right to see larger ones.

To see it in action, and to have a look at the source files (if you want), head here

projects, teaching ,

Purple Profiles

example output from the purple profile toolIn the wake of recent suicides by LGBT youths, some people have been wearing purple to show solidarity with LGBT youth and remind them that it does get better. I created a small PHP script to make it really easy to purple-ize a given JPEG, along with an option to add “it gets better” text to the bottom.

To try it for yourself, go here

projects , ,

HTML5: hierarchical animation

image chain Another day, another HTML5 experiment. This time around, I created a class to handle loading and drawing images. The image class also maintains a list of children, allowing for hierarchical animation.

View it here

projects , ,

More fun with HTML5 and the <canvas> tag

I just finished a second small html5 example. In this one, I create randomized terrain and place a soccer ball in the middle of the resulting field. The arrow keys will accelerate the ball left and right. The ball both follows the terrain and rotates as it moves.

Go here to see it in action.

projects , ,

Experimenting with HTML5

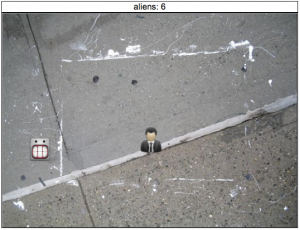
Just spent the evening watching Dexter and playing around with the canvas tag. I made a small game-like experiment that lets players control a man in black to capture aliens. Not terribly polished, but it’s a decent example of gameplay for a couple hours of messing around.

Click here to see the result in action.

projects , , ,

Chat Fiction

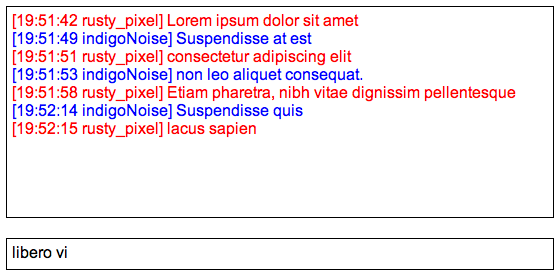
This was a small experiment in delivering fiction through a simulated chat interface. There are two characters, both with pre-scripted dialog. The user takes on one of the roles, with the other being automated.
 
The automated character “types” messages by waiting a set amount of time between adding lines of text, with the specific amount of time being a function of the number of characters in that line. Once the automated character has typed a line, control switches back to the user. Each keypress on the keyboard adds a letter to a simulated text entry field, with the letters coming from the script. Once the user has “typed” all of the letters for a given line, it is added to the ongoing dialog (as if they had pressed the enter key), and control switches back to the simulated character.
 
Check it out here.

projects ,

Metrics dashboard

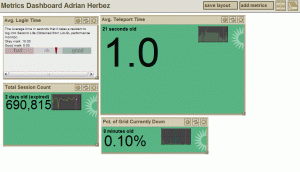
This was a tool I wrote while at Linden Lab to make it easy for employees to monitor metrics related to Second Life. A user could select metrics to subscribe to, which would then be displayed in individual windows. The background color (green, yellow, or red) of the window indicated whether the number was “good” (green), “bad” (red), or in between (yellow).

The stats reporting system was built by LL’s data warehousing team, and I built the frontend, including a windowing system implemented in javascript- each of the windows could be resized and moved around. Bigger windows would display their metrics in larger text, allowing users to highlight metrics that were especially important to them.

There was also a lightweight social component, in that the page to allow users to subscribe to metrics also displayed the usernames of everyone that had signed up to watch a given metric.

projects , ,

PHPtree

tree image generated with PHP and the GD library

tree image generated with PHP and the GD library

This was an experiment in learning the GD graphics library offered by PHP. The script generates a simple, graphic tree via a simple L-system, implemented via recursion.

Go here to see it for yourself.

projects , ,