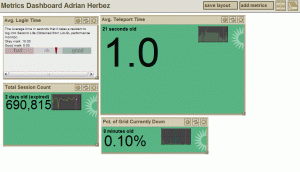
 This was a tool I wrote while at Linden Lab to make it easy for employees to monitor metrics related to Second Life. A user could select metrics to subscribe to, which would then be displayed in individual windows. The background color (green, yellow, or red) of the window indicated whether the number was “good” (green), “bad” (red), or in between (yellow).
The stats reporting system was built by LL’s data warehousing team, and I built the frontend, including a windowing system implemented in javascript- each of the windows could be resized and moved around. Bigger windows would display their metrics in larger text, allowing users to highlight metrics that were especially important to them.
There was also a lightweight social component, in that the page to allow users to subscribe to metrics also displayed the usernames of everyone that had signed up to watch a given metric.
projects
javascript, PHP, web
 I just finished a second small html5 example. In this one, I create randomized terrain and place a soccer ball in the middle of the resulting field. The arrow keys will accelerate the ball left and right. The ball both follows the terrain and rotates as it moves.
 Follow


